Data That Actually Moves Fast
Role: Principal Product Designer
In this industry, people were essentially driving by looking in the rearview mirror. Real estate agents and executives were making massive financial decisions based on data that was often four to six weeks old. By the time a monthly report landed on someone's desk, the market had already moved on.
I wanted to see if we could take a process that usually required a developer and a lot of waiting and turn it into something someone could do while sitting in their car between appointments.
The outcome
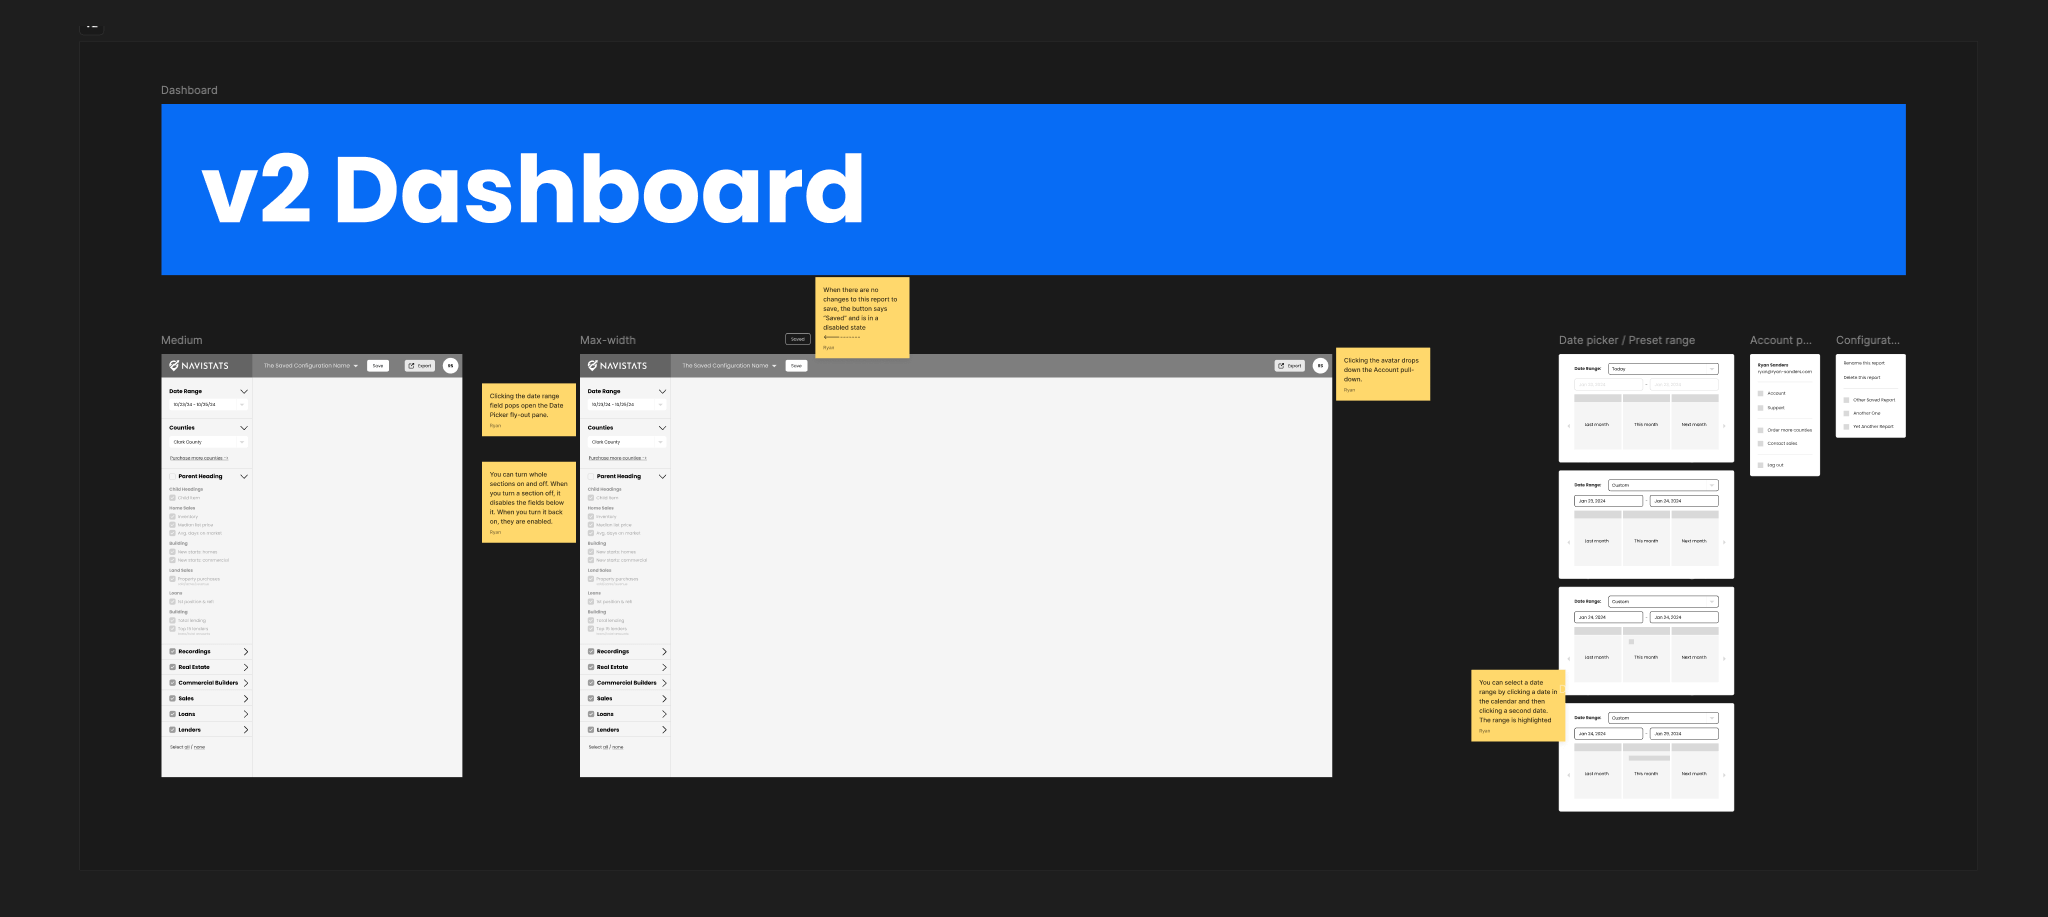
We built a platform that specialized in speed. The goal was to get a user from their first login to a meaningful insight as fast as humanly possible, because in this business, if a tool takes ten minutes to learn, it’s a tool that never gets used.
- 97-second average activation. We tracked the time from the moment a user verified their email to the moment they clicked "export" on their first custom market report. We found that if we could get them to that first "aha" moment in under two minutes, they were significantly more likely to become a daily active user.
- Scaling to 7 states in 12 months. Because the interface was designed to be modular, we could "plug in" new state-level data sets without having to redesign the experience every time we crossed a border.
- Replacing the old way. Within six weeks of joining, the average user stopped requesting manual reports from their home office entirely. We measured this by interviewing office admins who saw their "data request" tickets drop by nearly 80%.
"If a tool takes ten minutes to learn in this industry, it’s a tool that never gets used."
The anxiety of being second
When I interviewed sales reps, I realized their biggest fear wasn't "bad data"—it was being the last person to know something. They were tired of walking into a meeting only to find out the client already knew more about the neighborhood's trends than they did.
The executives had a different version of the same problem. They were flying blind, unable to see which of their offices were actually gaining market share until it was too late to help them. I realized I wasn't just building a dashboard; I was building a way for people to feel like they were back in control of their territory.
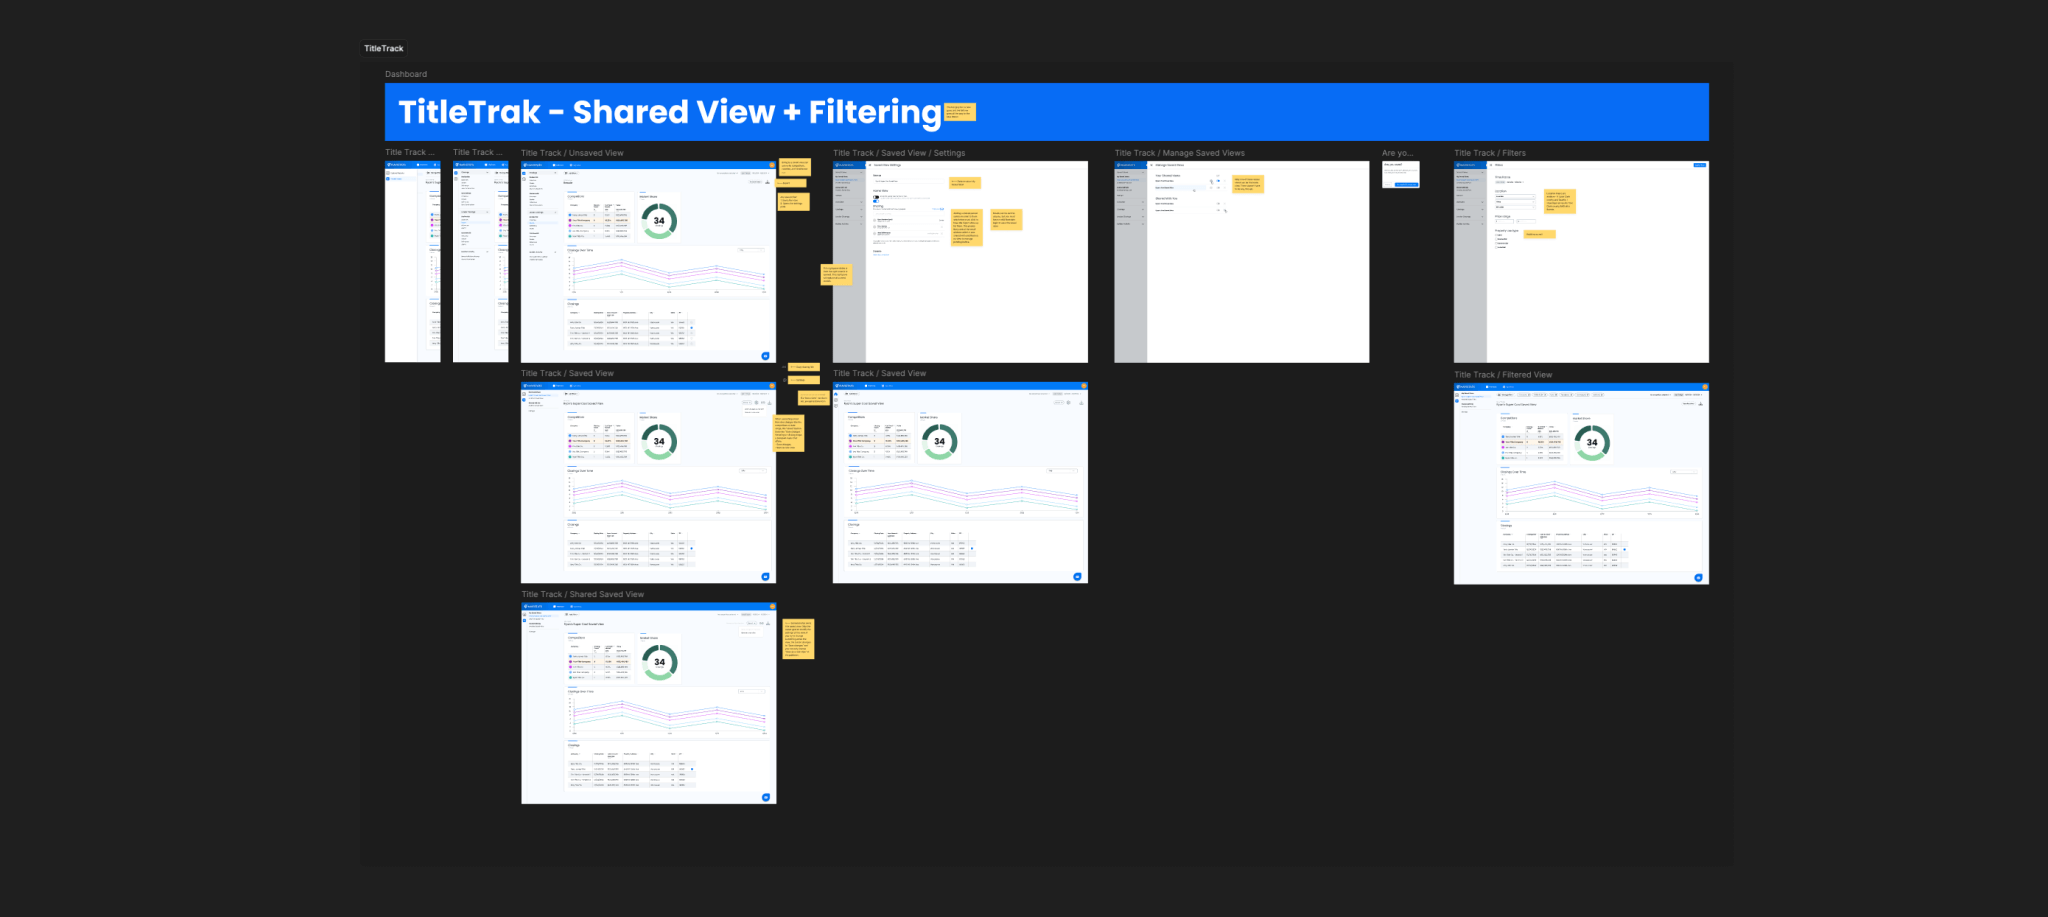
How I simplified the mess
I had to design two very different paths through the same data. For the person in the field, I focused on a mobile-heavy, geo-fenced experience. If you’re standing on a street corner, you don't want a 50-page PDF; you want to know who the top three agents are in a two-mile radius right now.
For the people in the office, I built a high-level view that prioritized trends over individual transactions. I spent a lot of time on the "visual grammar" of the charts. We used a very high-contrast UI—not because it looked "techy," but because I knew these reps would be looking at their phones in bright sunlight while standing in driveways.
"We used a high-contrast UI because I knew these reps would be looking at their phones in bright sunlight while standing in driveways."
My mistake: I tried to be too smart
Early on, I designed a very sophisticated "predictive" feature. I thought I could use the data to tell users where the market was going to be in six months. I spent weeks on the logic and the beautiful, complex visualizations for these forecasts.
It was a total flop. The users didn't trust it. They didn't want the app to be a fortune teller; they wanted it to be a reliable witness. They told me, "I don't need you to guess the future, I just need you to tell me exactly what happened yesterday so I can talk to my client with confidence." I had to strip out the "smart" features and refocus on making the raw data as clear and undeniable as possible.
What I'm still curious about
Now that we've solved for speed, I’m thinking about "density." How much data can we show on a small screen before a person stops feeling informed and starts feeling overwhelmed? We’re currently testing "progressive disclosure" patterns to see if we can keep that 97-second activation time even as the data sets get bigger.
"They didn't want the app to be a fortune teller; they wanted it to be a reliable witness."